Bitcoin’s grip on the $70,000 level finally slipped during early Monday trading, as a wave of profit-taking and shifting macroeconomic expectations pushed the world’s largest digital asset into a deeper corrective phase. After weeks of testing the resolve of bulls in the upper $60,000 range, the price action has turned decidedly defensive, leaving traders looking toward the next major psychological floor at $65,000.
The slide comes as the initial euphoria surrounding the spot ETF approvals begins to transition into a more sober assessment of liquidity. While the first quarter of 2024 was defined by aggressive inflows, the current momentum suggests that the market is entering a “cooling off” period. It’s a familiar pattern for seasoned observers: a rapid ascent followed by a period of painful consolidation that flushes out over-leveraged long positions.
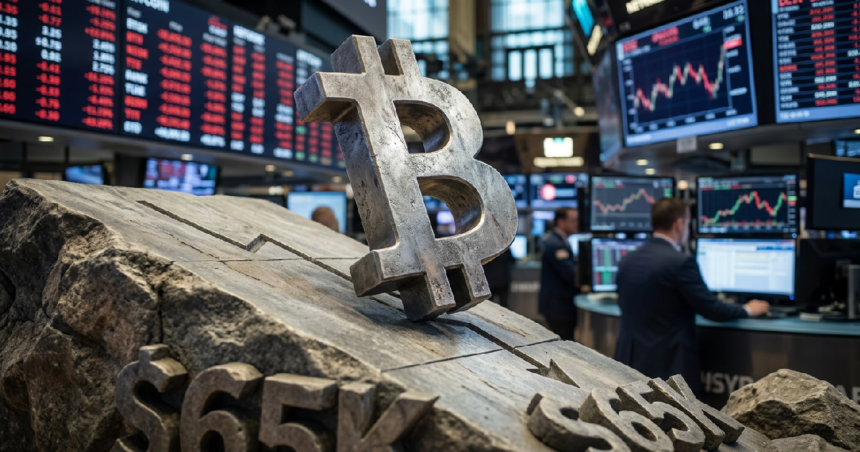
Pressure Mounts Near the $65,000 Support Level
Technical analysts have been eyeing the $65,000 mark for several days. This isn’t just a round number; it represents a zone where significant buying interest has historically clustered. If Bitcoin fails to hold this line, the narrative could quickly shift from a “healthy correction” to a more prolonged retracement. But for now, the order books suggest there is still plenty of appetite for the dip, even if the immediate outlook remains murky.
One factor weighing on the price is the shifting outlook for global interest rates. With inflation data proving “stickier” than many had hoped, the dream of rapid-fire rate cuts by the Federal Reserve is starting to dim. Bitcoin has often behaved as a high-beta play on global liquidity; when the “easy money” starts to look less certain, the more speculative corners of the market are the first to feel it. We are seeing that play out in real-time as traders de-risk their portfolios.
Grayscale Outflows and ETF Dynamics
The role of the spot ETFs remains central to the current price action. While institutional giants like BlackRock and Fidelity continue to see net inflows, the persistent “bleeding” from the Grayscale Bitcoin Trust (GBTC) continues to create a headwind. Every time it seems the market is ready to scale $72,000 again, a fresh batch of sell-side pressure emerges from these older holdings being rotated or liquidated.
And then there is the halving. We are now less than a month away from the quadrennial event that slashes the daily production of new Bitcoin in half. Historically, the weeks leading up to the halving are characterized by high volatility and “pre-halving jitters.” It’s a classic “buy the rumor, sell the news” setup that may be playing out earlier than expected this cycle. You can read more about how these institutional shifts are driving recent market resilience despite the price drops.
What Should Investors Watch Next?
For the remainder of the week, the focus will stay on daily ETF flow data and the 10-year Treasury yield. If yields continue to climb, Bitcoin will likely find it difficult to reclaim $70,000 in the short term. However, the underlying cooling of the market isn’t necessarily a bearish omen for the year. This type of price action often cleanses the market of excess “froth,” setting a more sustainable foundation for the next leg up.
The current volatility squeeze and narrow range patterns suggest that while the drop below $70,000 feels sharp, it is part of a broader consolidation phase. Whether $65,000 holds will tell us everything we need to know about the strength of the current bull market into the summer months.
Frequently Asked Questions
Why did Bitcoin fall despite the halving being so close?
The market often prices in major events like the halving months in advance. What we are seeing now is likely a combination of profit-taking by those who bought in lower and a reaction to higher-than-expected inflation data. It’s not uncommon for Bitcoin to see a “pre-halving shakeout” before the supply cut actually takes effect.
Is $65,000 the definitive bottom for this move?
Markets aren’t that predictable, unfortunately. While $65,000 is a major area of support where many buyers are expected to step in, a break below that could see Bitcoin testing levels closer to $60,000. Traders are watching the volume at these levels to see if the selling pressure is exhausting itself or just getting started.
How are institutional investors reacting to the drop?
Most data suggests that long-term institutional players aren’t panicked. Organizations like BlackRock tend to have a multi-year horizon. However, tactical traders and hedge funds that use Bitcoin for momentum plays are likely the ones pulling back as the $70,000 level failed to hold, leading to the current downward pressure.