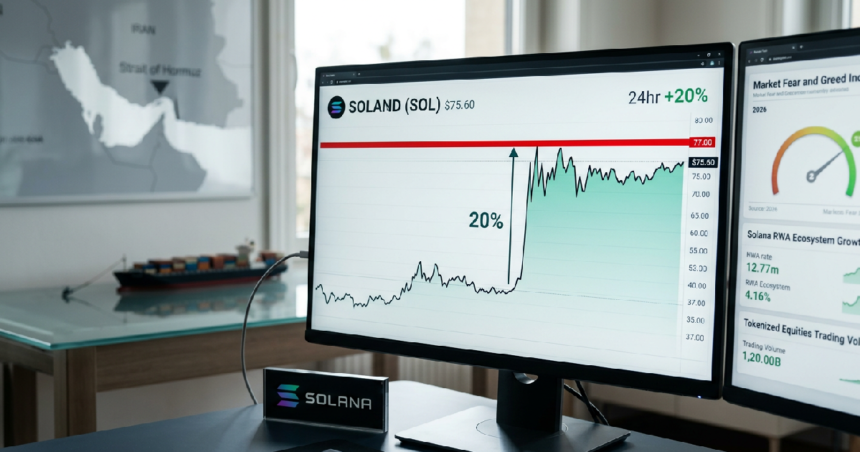
Solana (SOL) surged over 20% from its June low of $62.44 to reach a monthly high of $75.60 before hitting a wall of sell-out pressure at key technical resistance levels on June 17, 2026. The rally, which saw SOL changing hands around $72.
50 at press time, was fueled by the reopening of the Strait of Hormuz and a landmark peace agreement between the U.S. and Iran. While geopolitical easing sparked a broader rotation into risk assets, Solana’s recovery remains fragile as high inflation data and a strengthening U.S. dollar dampen market sentiment.
The network’s resurgence in early June was not merely a reaction to global politics. Much of the momentum came from a massive spike in tokenized equity activity, with Solana capturing 97% of the cumulative spot trading volume for on-chain stocks.
The launch of SpaceX equity products and the introduction of SoFiUSD—the first stablecoin from a nationally chartered U.S. bank—cemented the network’s position as the primary hub for real-world assets (RWA). This surge in utility has reached a point where 200,000 unique holders now own tokenized securities on the blockchain.
Geopolitical stability and institutional accumulation drive the Solana rally
The sudden de-escalation in the Middle East acted as a primary catalyst for the crypto market. When the U.S. administration announced the reopening of the Strait of Hormuz, oil prices plunged, freeing up capital for high-beta assets like SOL. This macro shift coincided with heavy corporate accumulation.
Publicly traded companies reportedly increased their SOL holdings throughout June, while several Solana-focused treasury firms entered takeover discussions, tightening the available supply in a market where two-thirds of the token is already locked in staking.
Despite these fundamental wins, the daily price structure remains historically difficult. Solana is currently trading below its 20-day, 50-day, and 200-day Exponential Moving Averages (EMAs), signaling that the long-term trend hasn’t fully turned. Even as Bitcoin gains on geopolitical pauses, Solana faces a specific “bearish flag” pattern on its daily chart.
This technical setup often precedes a continuation of a prior downtrend unless bulls can force a decisive close above the $75.20 Supertrend resistance.
Real-world assets and stablecoin integration bolster ecosystem value
The expansion of the Solana ecosystem has reached a critical mass in the financial sector. Cash App’s decision to add USDC on Solana and the launch of over 200 securities via Exodus and Ondo Finance have transformed the chain into a bridge for traditional finance.
Unlike previous cycles driven by pure speculation, the current price action is anchored by tangible on-chain products. For instance, the record-breaking 200,000 tokenized stock holders provide a floor of active users that didn’t exist during the 2024-2025 bear markets.
However, the internal economy of the network is showing signs of exhaustion. Decentralized exchange (DEX) fees have dropped sharply, with Raydium reporting a 45% daily decline and Orca seeing a 71% monthly collapse as of June 14.
This suggests that while institutional “buy and hold” activity is up, the retail-driven trading frenzy that previously propelled SOL may be cooling. This divergence between high-level RWA adoption and declining DEX revenue creates a complex valuation landscape for traders eyeing the $78 target.
Technical resistance at $78 remains a formidable hurdle for bulls
Traders are currently focused on a pivotal test zone between $75 and $78. This region previously served as critical support during early 2026 and has now flipped into a “supply zone” where sellers are expected to defend their positions. A push toward $79.
50 is possible, but only if the price can stay above the $67.00 support level. Currently, the daily Relative Strength Index (RSI) sits at 44.56, indicating that selling pressure has subsided without yet being replaced by aggressive buying momentum.
External factors continue to weigh on the price. The Federal Reserve’s recent lean toward higher-for-longer interest rates following hot inflation data has sent the Fear & Greed Index to a reading of 20, or “Extreme Fear.” While some believe Ether is entering an accumulation phase, Solana investors appear more cautious.
They are balancing the explosive growth in tokenized equities against a macro environment that heavily favors a strong U.S. dollar over digital assets.
Outlook for Solana as liquidity conditions tighten
The path forward for SOL depends largely on whether it can break the $75.60 peak established during this latest bounce. If the token stalls here, a retest of the $62.44 low is likely, especially if the Federal Reserve remains hawkish.
The high percentage of staked supply acts as a double-edged sword; it creates liquidity crunches that fuel 20% rallies, but it also means that a wave of unstaking could accelerate a price slide if the “Extreme Fear” sentiment persists throughout late June.
Market analysts note that the current liquidity surge is different from prior “meme coin” summers. The massive volume in tokenized stocks suggests that Solana is evolving into a professional-grade settlement layer. If the network can maintain its 97% dominance in the RWA sector, the $78 resistance may eventually turn into a long-term floor.
For now, however, the combination of technical overhead and Fed-induced volatility suggests that the 20% jump may be a temporary relief rally rather than the start of a new bull run.