

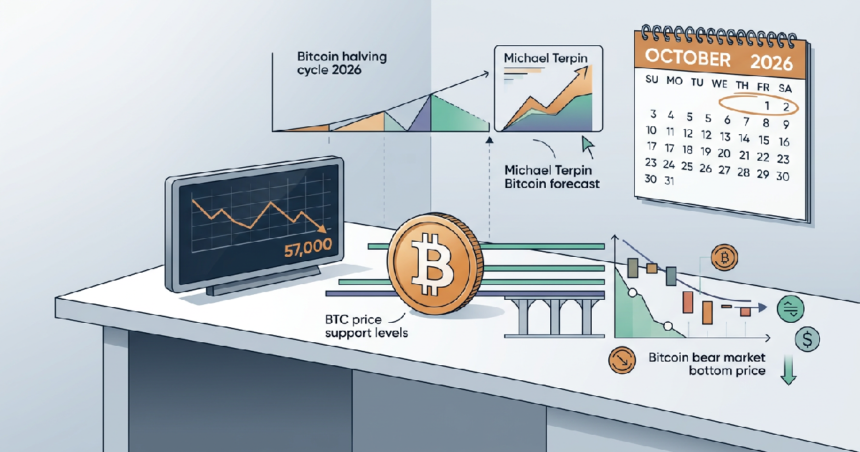
Bitcoin (BTC) may reach a market cycle bottom of approximately $57,000 in October 2026 if historical reward-halving patterns remain consistent with previous cycles. Several prominent analysts, including Michael Terpin and veteran trader Peter Brandt, have identified October as the likely window for a price floor following Bitcoin’s October 2025 all-time high of $126,200. This forecast aligns with the historical average drawdown that typically concludes roughly one year after a cycle peak.
The projection rests on the tendency for bear markets to bottom out 12 to 18 months before the next halving event, which is scheduled for April 12, 2028. Currently, the network is fewer than 100,000 blocks away from this programmed supply adjustment. At that time, mining rewards will drop from 3.125 BTC to 1.5625 BTC per block. While Bitcoin holds steady as mid-cap tokens face selling wave pressure, historical data suggests the price may still need to digest a significant portion of its previous gains.
According to investor Michael Terpin, the $57,000 target represents a logical conclusion to the current correction. Other analysts, including Benjamin Cowen and those at Cointelegraph, have flagged similar timeframes. Historically, the bottom appears 25 to 30 months after a halving, with the average duration from cycle top to bottom lasting roughly 383 days—or just over a year.
Historical precedents for market cycle bottoms
The rhythm of the Bitcoin market is largely dictated by the 210,000-block halving cycle. In previous bears, the peak-to-trough drop has ranged between 77% and 87%. During the first halving cycle in 2012, the market experienced a maximum drawdown of 87%. While institutional involvement has changed the market structure, the 2026 forecast suggests a more moderate but still painful 50% to 60% decline from the $126,200 peak.
Jiang Feng Capital recent data suggests the bottom could fall between May and October 2026, targeting a price of roughly $58,000. This estimate is supported by many participants who expect bears to maintain control for several more months. Even as technical signals point toward a volatility spike, many traders remain cautious about a larger leg lower before the year concludes.
Recent price action shows Bitcoin trading near $77,987 as of late April, having rallied 29% from its February low of $60,000. However, Matthew Hyland and other analysts believe the consensus outcome remains a descent toward the October window. If the cycle holds, the current trading range may be a temporary pause before a final capitulation phase.
Critical support zones and short-term risks
Immediate market stability depends on a few specific price levels. Jean-David Péquignot, Chief Commercial Officer at the derivatives exchange Deribit, identified the $76,000 to $77,000 zone as a critical support level. A clean break below this range could open the door to the $70,000 to $72,000 area, with $60,000 serving as the next major psychological floor.
Additional risks to the upside include hardening Treasury yields, elevated oil prices, and outflows from spot Bitcoin ETFs. These macroeconomic factors often weigh on speculative assets. Fidelity’s Director of Global Macro, Jurrien Timmer, suggests that a broader range of $65,000 to $75,000 may provide support throughout much of 2026, though the historical cycle average points deeper.
While the market watches for a potential bottom, regulatory shifts continue in the background. The Securities and Exchange Commission (SEC) is reportedly moving to propose a framework for tokenized stocks as Wall Street firms seek to integrate traditional securities with blockchain technology. This move highlights the deepening institutional interest despite the current cyclical price correction.
Geopolitical and macroeconomic factors
External pressures from the global theater are also influencing current price volatility. Japan and China have recently led a retreat from U.S. Treasuries to protect their local currencies against an energy-driven economic shock. China’s holdings have reportedly fallen to their lowest levels since 2008 as central banks liquidate dollar reserves to defend against tumbling exchange rates.
In the Middle East, a standoff between the U.S. and Iran continues to create economic friction. A U.S. blockade and tensions over the Strait of Hormuz have raised the risk of renewed conflict, according to reporting by Reuters. These geopolitical events often result in immediate “risk-off” selling across most asset classes, including cryptocurrency.
For long-term investors, the focus remains on the April 2028 halving. If the October 2026 bottom at $57,000 materializes, it would mark the start of the accumulation phase that historically leads to new highs. Until then, the market appears poised to follow the mathematical regularity of the supply issuance that has governed Bitcoin for over a decade.