

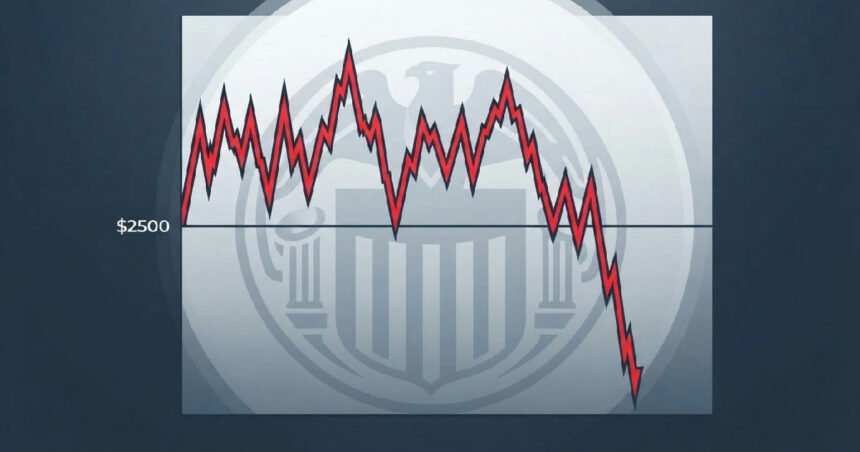
Ethereum (ETHUSD) experienced intensified volatility on September 14, 2026, registering a notable intraday pullback as institutional investors pared back risk exposure. The leading altcoin was trading at $2482.88 by 20:10 ET, marking a 1.09% decline for the day and a 0.38% dip over the past seven days. This downturn comes ahead of a crucial Federal Reserve monetary policy decision, sparking caution across broader financial markets.
The cryptocurrency’s price action reflected a broader re-evaluation of short-term liquidity conditions, pushing macro-focused investors to temporarily reduce their positions in high-beta digital assets. Its inability to hold above the psychological $2500 level further exacerbated downward pressure. Analysts now point to technical resistance and leveraged market positioning as key factors influencing the recent slide.
Macroeconomic headwinds fuel Ethereum volatility
The primary catalyst behind Ethereum’s recent retreat stems from a wave of institutional de-risking. Major players in the financial sector are actively shedding risk as they brace for significant macroeconomic announcements, most notably the impending Federal Reserve interest rate decision. This anticipation creates a climate of uncertainty, particularly impacting speculative assets like cryptocurrencies.
Elevated Treasury yields are also contributing to this less favourable environment for risk assets. Higher yields on traditional government bonds often attract capital away from more volatile investments, including the digital asset space. Consequently, funds have been shifting, with investors reassessing their portfolios in anticipation of broader crypto market trends.
The Federal Reserve is set to announce its interest-rate decision on September 16. This highly anticipated event is a critical macroeconomic juncture, with its outcome expected to heavily influence the direction of interest rates and investor appetite for riskier assets. The market remains on edge, awaiting clarity from the central bank.
CLARITY Act Vote Adds Regulatory Uncertainty
Adding another layer of market jitters, the U.S. Senate is scheduled to vote on cloture for the CLARITY Act on September 15. This legislative move, coming just a day before the Fed’s decision, contributes to regulatory uncertainty surrounding digital assets.
While Polymarket places the odds of the CLARITY Act becoming law in 2026 at a modest 16%, with Galaxy Research at 10%, the vote itself remains a point of focus for investors.
Technical Barriers and Leveraged Positioning Drive Price Action
Ethereum’s price trajectory encountered significant technical resistance near the $2500 mark. This level has proven to be a pivotal psychological barrier for the cryptocurrency. Despite a brief surge above $2,600 on September 11, following the release of U.S. Consumer Price Index data, Ethereum couldn’t maintain that momentum.
The failure to decisively breach this overhead resistance triggered systematic selling pressure. The resilience of the $2500 level exposed the price to downside movement, causing it to break below the support of its EMA50. This technical breakdown is often interpreted as a bearish signal, suggesting potential for further declines.
Over $1.2 Billion in Long Positions at Risk
A substantial unwinding of leveraged positions further fueled Ethereum’s decline. The perpetual derivatives market, in particular, had become increasingly stretched after a sustained multi-week rally. This over-leveraging creates conditions where even small price movements can trigger significant forced selling.
Localised long liquidations intensified the downward pressure. Market estimates indicate over $1.2 billion in long positions are vulnerable to forced liquidation cascades if ETH breaches the $2,405 price threshold. Such an event could accelerate any sell-off, impacting the network’s inherent strength.
As of September 14, technical indicators paint a mixed picture for Ethereum. The MACD (12,26,9) value stands at -35.401, suggesting a neutral signal. The Relative Strength Index (RSI) is at 59.469, also indicating a neutral condition. However, the Williams %R sits at 61.257, signaling a potential sell condition.
Ethereum’s Market Footprint and Historical Trends
Despite the recent price volatility, Ethereum maintains a substantial presence in the global crypto market. As of September 14, 2026, its market capitalization stood at $306,475,896,614, or approximately $305.77 billion. This positions Ethereum with around 11.4% of the global crypto market capitalization, or about 11.1% of the total.
The 24-hour trading volume for Ethereum also reflects significant activity, reaching $10,854,665,064, or approximately $10.42 billion. Other measurements put the volume at $5.54 billion or $4.65 billion, underscoring its liquidity. The global crypto market capitalization overall was $2.69 trillion, down 0.9% over 24 hours.
September: A Historically Weak Month
Historical data reveals that September has typically been a challenging month for Ethereum. Since 2016, the cryptocurrency has recorded an average return of -6.53% during this month. It has experienced value loss in September in six of those years, with five instances of double-digit declines, highlighting a consistent seasonal pattern of weakness.
Prior to its current pullback, Ethereum saw its price fall to $2,220 on August 20, 2026, before climbing 10.8% to reach $2,460. The cryptocurrency had opened 2026 at a higher valuation of $2,966. This contextualizes the current price action within a broader narrative of fluctuations throughout the year.
Resilient Inflows and Future Price Outlook
Despite the short-term price pressures, underlying fundamentals for Ethereum indicate structural strength and growing institutional interest. The network continues to show resilient activity, accompanied by consistent cumulative institutional inflows. These sustained investments suggest a more enduring confidence in the asset.
Notably, U.S. spot Ethereum ETFs recorded $34.7 million in net inflows on September 9. This inflow demonstrates an ongoing trend of institutional staking growth and adoption within regulated financial products, providing a counterpoint to the recent price declines. Such inflows signal a deepening integration of Ethereum into traditional financial frameworks.
Looking ahead, traders are closely monitoring key support and resistance levels to gauge Ethereum’s next move. The $2,370 level is considered a critical support point. A breach below this could potentially lead to a decline towards $2,200, according to technical analysts.
Conversely, breaking past the $2,550 mark is seen as essential for an upside exit from the current consolidation phase. Options market positioning further reinforces potential downside pressure, with significant clustering around lower downside strikes at $2,250. This indicates a segment of traders are betting on a return to that level in the near term.